The Relationship Graph Grew Faster Than the Contact List: What September Made Possible
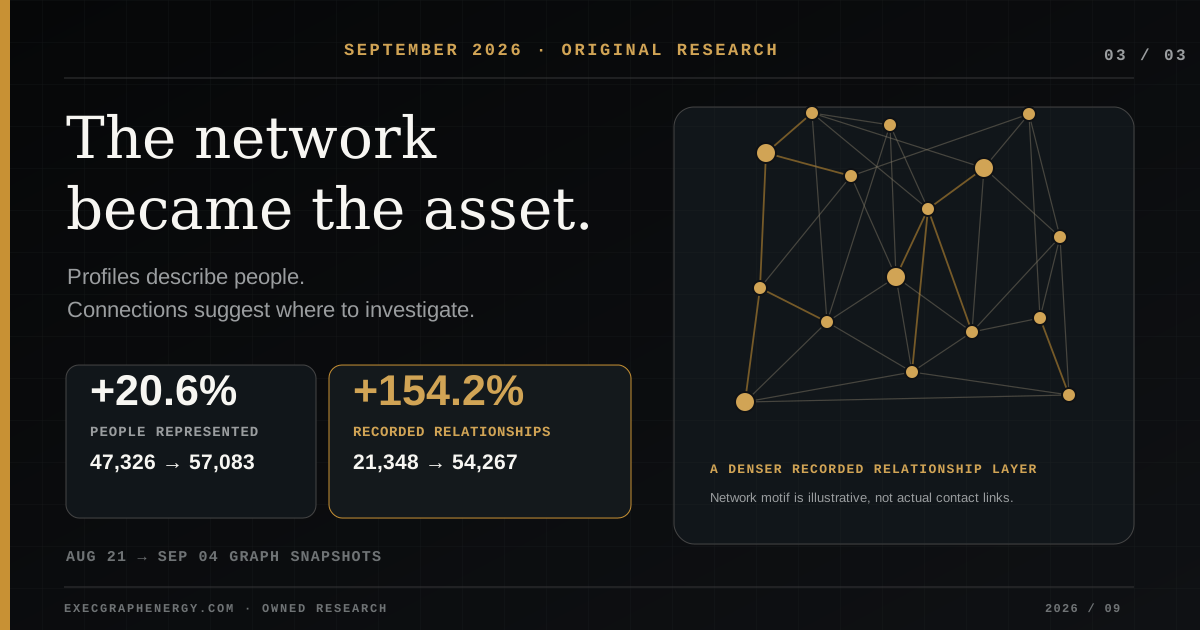
Between ExecGraph's August 21 and September 4 Energy graph snapshots, represented people grew 20.6% while recorded relationships grew 154.2%. September Warm Path learning also recorded 288,704 meaningful relationship events, creating a much richer test bed for graph-aware contact discovery.
A larger contact database is useful. A denser relationship graph can be more interesting.
Between ExecGraph's August 21 and September 4 Energy snapshots, the number of represented people grew from 47,326 to 57,083, a 20.6% increase.
Recorded relationship edges grew from 21,348 to 54,267, a 154.2% increase.
The relationship layer grew about seven and a half times faster than the contact population.
September added relationship evidence every day
The graph did not stop changing after the September 4 experiment snapshot.
Across 30 September Energy learning rollups, Warm Path recorded 288,704 meaningful events.
Within those daily rollups were 148,887 new-relationship events, 25,304 strengthened-relationship events, and 5,774 weakened-relationship events. The same learning stream also registered 88,250 semantic changes, 10,895 facility changes, 4,862 role changes, 2,467 company changes, and 3,097 new-shared-context events.
Those classifications are not mutually exclusive, so they should not be added together as separate relationships. They show the different ways the relationship evidence changed during the month.
This is the raw material GraphSAGE needs
GraphSAGE is interesting only if the graph contains useful structure.
A profile-only model can compare titles, roles, company context, and semantic similarity. A graph-aware model can also learn from the pattern of recorded relationships around a person.
That creates a different possibility: two people with different titles may still be relevant because they sit in adjacent professional neighborhoods. Two people with nearly identical profiles may not be equally useful if one has no credible relationship path into the target account.
The September graph became large enough to test that idea more seriously.
The model improved as the graph deepened
On the August 21 fixed-reference test, GraphSAGE recorded test ROC AUC of 0.8302. On September 4, it reached 0.8802.
That is a five-point improvement on the same metric definition.
The semantic comparator also improved, from 0.8824 to 0.9058. It still led GraphSAGE on ROC AUC.
Average precision told a tighter story. GraphSAGE moved from 0.8731 to 0.9071. The semantic comparator moved from 0.8740 to 0.9061. On the September snapshot, the two were effectively neck-and-neck on average precision, with GraphSAGE slightly higher.
| September 4 test | GraphSAGE | Semantic comparator |
|---|---|---|
| ROC AUC | 0.8802 | 0.9058 |
| Average precision | 0.9071 | 0.9061 |
That does not prove GraphSAGE is better for sales. It does show that the graph-aware signal became competitive enough to justify product-level testing.
The September experiment record identified 632 distinct Warm Path targets in the comparison cohort.
All 632 were present in the September graph and had at least one recorded relationship. 586 of them, or approximately 92.7%, had at least five recorded relationships. Their average full-graph degree was 7.12.
That is a much more useful product test population than a random set dominated by isolated people.
When a target has multiple credible relationship candidates, the system can ask two real product questions:
- Can graph structure reorder the same candidates better than profile similarity alone?
- Can graph structure surface a useful candidate that the existing shortlist missed?
The first is reranking. The second is candidate expansion. They should be measured separately.
The long-term possibility is not a “GraphSAGE score” on a contact card.
It is a better answer to a practical question: who around this target gives me the most credible route into the conversation?
A graph-aware system could potentially elevate a former colleague, cross-company connection, shared-facility relationship, or adjacent professional path that a title-based search would not rank highly.
That candidate still has to pass evidence checks. A model prediction is not proof that two people know each other well enough for an introduction.
But the graph can tell the system where to investigate.
Why the September relationship-learning volume matters
The most important September number may not be the model score.
It may be the fact that the underlying relationship evidence kept changing at scale: 288,704 meaningful events across the month, with 148,887 new-relationship events and tens of thousands of strengthened, semantic, facility, role, and company-context changes.
That is what can make the graph compound.
The contact record tells you who someone is today. The relationship graph can preserve who they worked with, where their professional paths overlap, how the surrounding network changed, and which route may have become more or less credible.
The next useful proof is shortlist quality
The September evidence supports continued testing, not a claim that GraphSAGE should replace production Warm Path ranking.
The practical next proof is whether a graph-aware shortlist produces more relevant, evidence-supported candidates for real targets.
That means measuring top-one changes, top-three and top-five overlap, useful candidate additions, unsupported recommendation rate, and reviewer judgment on the same frozen targets.
If network structure consistently adds a credible person the existing system missed, the graph becomes more than a database feature. It becomes an access advantage.
Data source and methodology
This article combines two ExecGraph-owned September evidence sets.
The graph-growth and model results come from the fixed August 21 and September 4 Energy GraphSAGE experiment records. The September learning-volume figures come from the 30 production Energy warm_path_daily_learning_rollups dated September 1 through September 30, 2026.
Daily learning classifications can overlap and are presented as event dimensions, not additive unique relationship counts. GraphSAGE remained an experimental/shadow challenger in the cited September study and did not establish sales conversion, introduction success, or revenue impact.
No person-level graph data or private relationship records are published. See ExecGraph Research for the broader GraphSAGE evidence record and ExecGraph methodology for the evidence framework.
Underlying research figures
Review the downloadable, machine-readable aggregate figures behind this analysis. ExecGraph publishes these observations and their measurement limitations, not private contact identities, raw relationship edges, or customer-specific pursuits.
Questions Answered
How much did the ExecGraph Energy relationship graph grow between August 21 and September 4?
Represented people grew from 47,326 to 57,083, a 20.6% increase. Recorded relationship edges grew from 21,348 to 54,267, a 154.2% increase.
How much relationship-learning activity occurred during September?
Across 30 daily Energy learning rollups, ExecGraph recorded 288,704 meaningful events. Those rollups included 148,887 new-relationship events, 25,304 strengthened-relationship events, 5,774 weakened-relationship events, and 88,250 semantic-change events. These classifications can overlap.
Did GraphSAGE beat the semantic comparator in September?
Not across every metric. On September 4, GraphSAGE test ROC AUC was 0.8802 versus 0.9058 for the semantic comparator. GraphSAGE average precision was 0.9071 versus 0.9061 for the comparator. The result justified continued investigation, not a production replacement claim.
What is the practical possibility for sales teams?
The practical opportunity is to use relationship structure to rerank credible warm-path candidates or surface additional candidates that profile similarity alone may miss, then require evidence and user context before presenting a route as actionable.
Explore the decision chain at the facilities mentioned above
ExecGraph organizes 47,000 industrial business records across 1,300 organizations in 12 markets. Record-level source, date, and confidence can vary by pursuit.
Request accessAccess requests are reviewed before an account is activated.