ExecGraph original research
The five-year gap in directors' company tenure
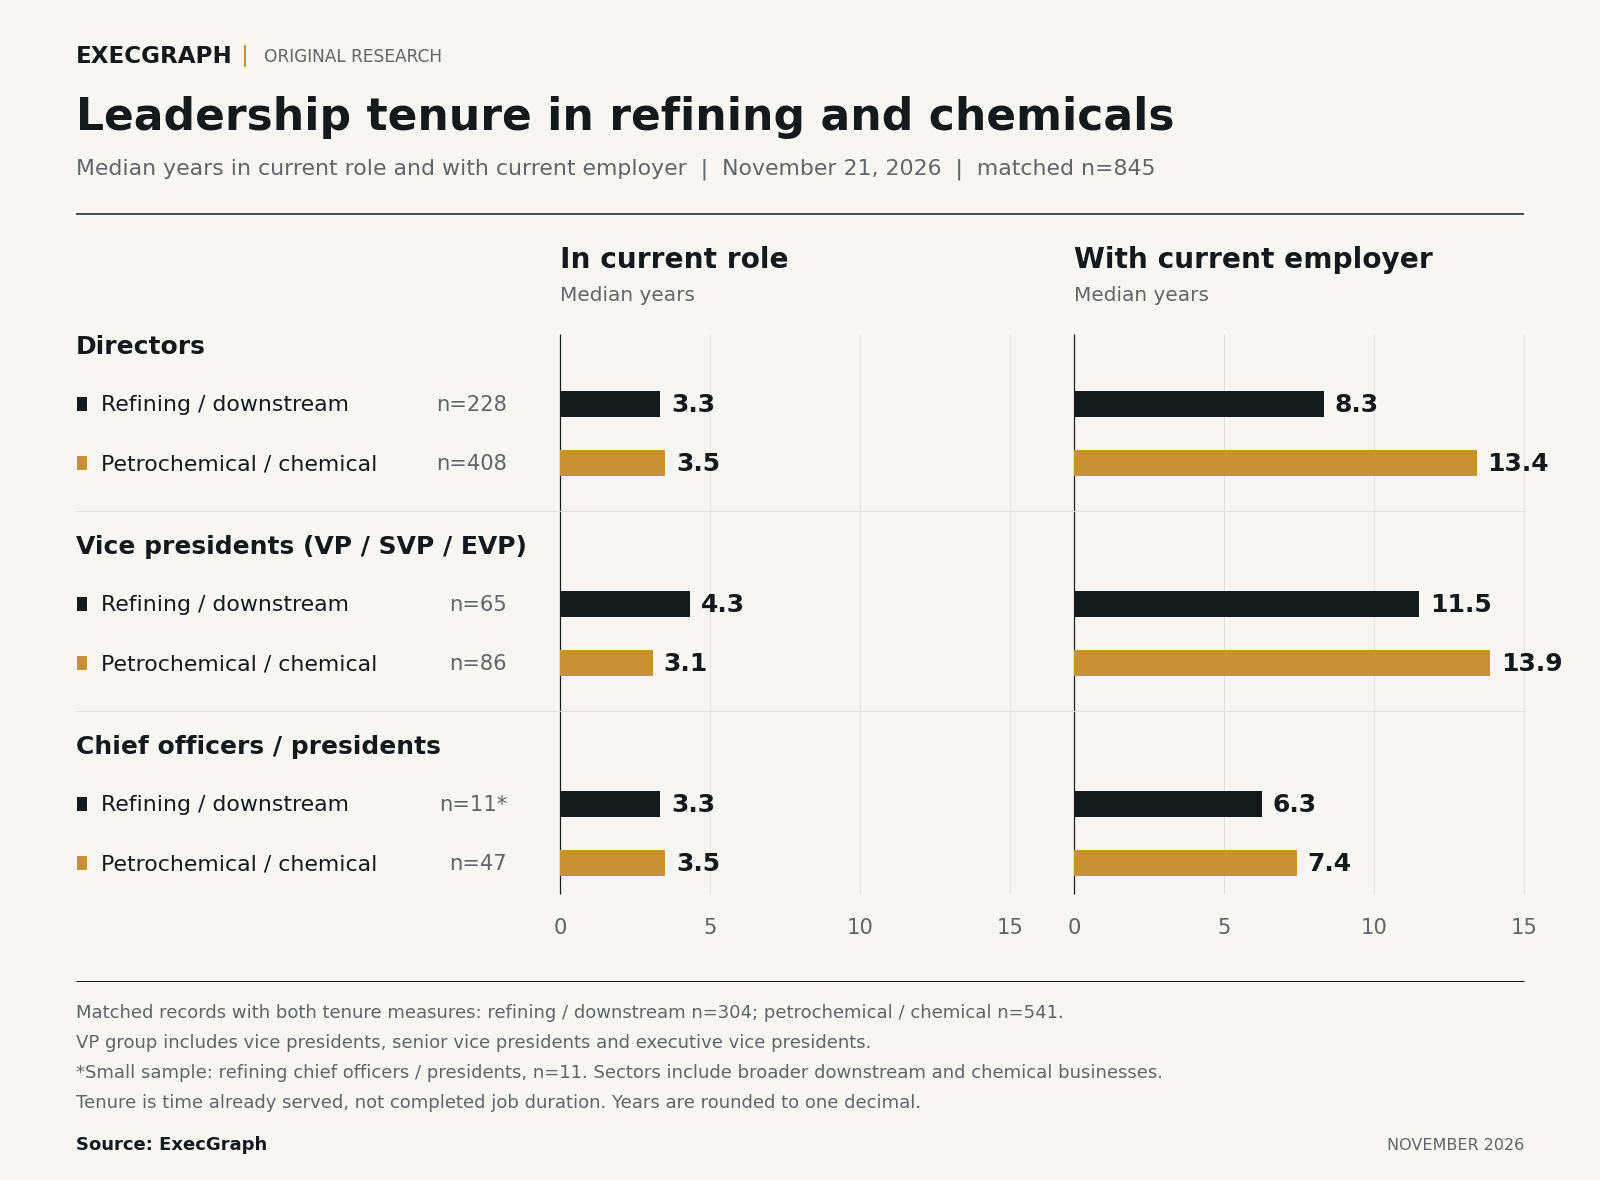
Chemical directors have spent a median 13.4 years with their current employer. In refining, the figure is 8.3 years. Their current roles are almost the same age.
Explore the tenure comparison
- Matched leadership records
- 845
- Refining and downstream
- 304
- Petrochemical and chemical
- 541
A director in the chemical group has typically been with the current employer five years longer than a director in the refining group. Yet the median time in their present positions differs by only two months: 42 months in chemicals and 40 in refining.
The comparison covers 408 petrochemical and chemical director records and 228 refining and downstream director records with dates for both the current role and current company. Median means the middle value when records are ordered from shortest to longest tenure.
Twenty years at the same company
The difference extends to long service. Nearly three in ten chemical directors have at least 20 years of documented company history. In refining, the share is about one in six.
Petrochemical and chemical
29.7%121 of 408 directorsRefining and downstream
15.4%35 of 228 directorsDirectors with at least 20 years at the current company. Both groups use the same matched records as the tenure comparison below.
The chemical group has longer company service at the midpoint and a larger share with two decades at the employer. The ordering also remained when records assigned to the largest covered employer in each sector were excluded.
The tenure comparison
Median tenure by leadership role
Role tenure starts when the current position began.
Company tenure starts with the documented current period of employment.
Directors
Management directors; board-only titles excluded
Median years in current role
Median years with current employer
Vice presidents
VP, senior VP and executive VP
Median years in current role
Median years with current employer
Chief officers and presidents
Includes enterprise, business-unit, regional and site presidents
Median years in current role
Median years with current employer
View the complete chart image
Open the full resolution chart · Credit: Jimmy Theoc and ExecGraph Energy
636 directors
151 vice presidents
58 chief officers and presidents
Refining VPs have held their current roles longer
At the vice-president level, refining has the longer current-role median: 4.3 years, compared with 3.1 years in chemicals. The underlying values are 52 and 37 months, a 15-month difference.
Company tenure runs the other way. Chemical VPs have spent a median 13.9 years with their employers, compared with 11.5 years in refining. The group includes vice presidents, senior vice presidents and executive vice presidents.
That leaves two distinct observations. Chemical directors and VPs have longer documented company histories. Refining VPs have older current assignments, while the director groups are close in time served in their present roles.
A smaller view of chief officers and presidents
Chief officers and presidents have median company tenures of 6.3 years in refining and 7.4 years in chemicals. Their current-role medians are 3.3 and 3.5 years.
These figures cover 11 refining records and 47 chemical records. The category includes enterprise, business-unit, regional and site presidents as well as chief officers. It is broader than a CEO comparison, and the small refining sample warrants caution.
The overall median hides the VP difference
Combining all three groups produces nearly identical current-role medians: 41 months in refining and 42 months in chemicals. Directors make up 636 of the 845 matched records, or 75.3%, so they heavily influence that pooled result.
The role-by-role comparison preserves the finding the overall number loses: a 15-month difference in current-role tenure for VPs, alongside a 61-month difference in company tenure for directors.
Public aggregate dataset
The numbers behind the story
Six role and sector groups. The same records supply both medians in every row.
Directors
| Sector | Records | Current role | Current company |
|---|---|---|---|
| Refining and downstream | 228 | 3.3 yr40 months | 8.3 yr100 months |
| Petrochemical and chemical | 408 | 3.5 yr42 months | 13.4 yr161 months |
Vice presidents
| Sector | Records | Current role | Current company |
|---|---|---|---|
| Refining and downstream | 65 | 4.3 yr52 months | 11.5 yr138 months |
| Petrochemical and chemical | 86 | 3.1 yr37 months | 13.9 yr166.5 months |
Chief officers and presidents
| Sector | Records | Current role | Current company |
|---|---|---|---|
| Refining and downstream | 11 | 3.3 yr40 months | 6.3 yr75 months |
| Petrochemical and chemical | 47 | 3.5 yr42 months | 7.4 yr89 months |
Source and method
Jimmy Theoc and ExecGraph Energy. Snapshot: November 21, 2026. The source cohort contains 1,326 title-qualified contact records; 845 have dates for both the current role and current company. Sector groups include broader downstream and chemical businesses. Board-only director titles are excluded.
Company tenure covers the documented current employment period; incomplete histories can understate service. Medians give each record equal weight, rather than each employer. Years are rounded to one decimal from the month values shown above. These are observed records, not an industry census. Tenure measures time already served, not completed job duration or turnover. Individual and employer names are omitted.
About the numbers
How does director tenure differ between refining and chemicals?
In ExecGraph's November 2026 sample, chemical directors had median company tenure of 13.4 years, compared with 8.3 years in refining and downstream. Median current-role tenure was 3.5 versus 3.3 years. The comparison covers 408 chemical directors and 228 refining directors with both dates available.
Which leadership roles are included?
The 845 matched records comprise 636 directors, 151 vice presidents including senior and executive vice presidents, and 58 chief officers or presidents. There are 304 refining/downstream records and 541 petrochemical/chemical records. Board-only director titles are excluded.
What is the difference between company tenure and role tenure?
Company tenure is time since the start of the documented current period of employment. Role tenure is time since the current position began. Both measure time already served as of November 21, 2026. They do not measure completed job duration or predict how long someone will stay.